Learning about keystone species through concept maps makes ecology easier to understand. This guide shows you simple ways to create clear visual maps that help students learn better.
What Are Keystone Species?
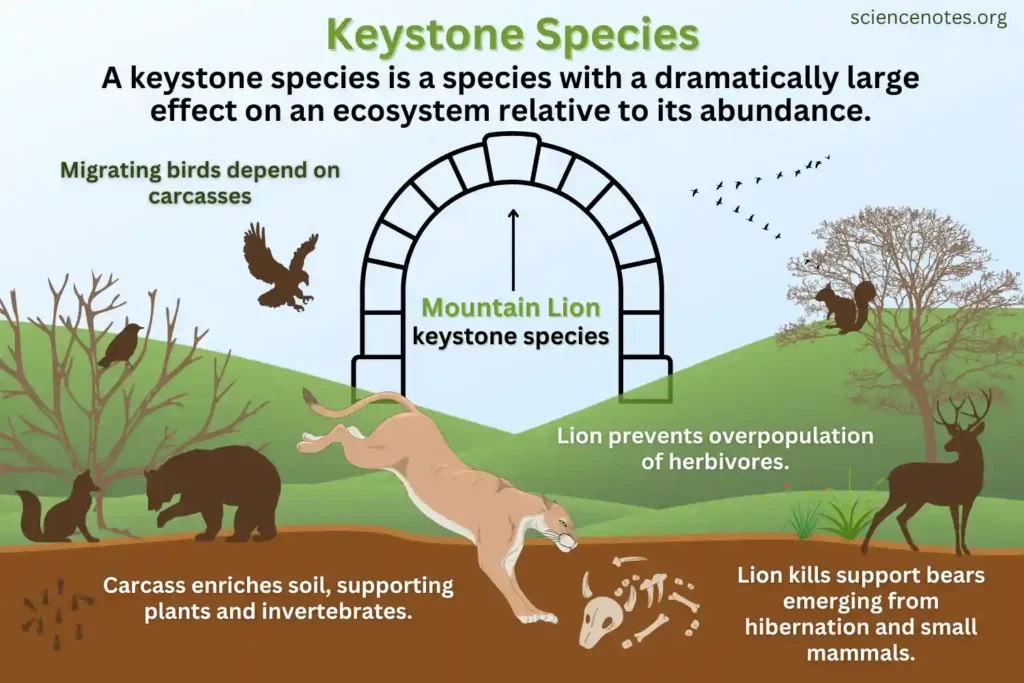
Keystone species are very important animals or plants in nature. They keep whole ecosystems working properly. When these species disappear, many other species suffer too.
Think of them like the main support beam in a house. Remove that beam and the whole house falls down.
Why Keystone Species Matter
- They control other animal populations
- They change the environment around them
- They help many other species survive
- They keep nature balanced
- They provide food for other animals
Common Examples
- Wolves in forests
- Sea otters in oceans
- Bees that pollinate flowers
- Elephants in grasslands
- Coral in reef systems
What Are Concept Maps?
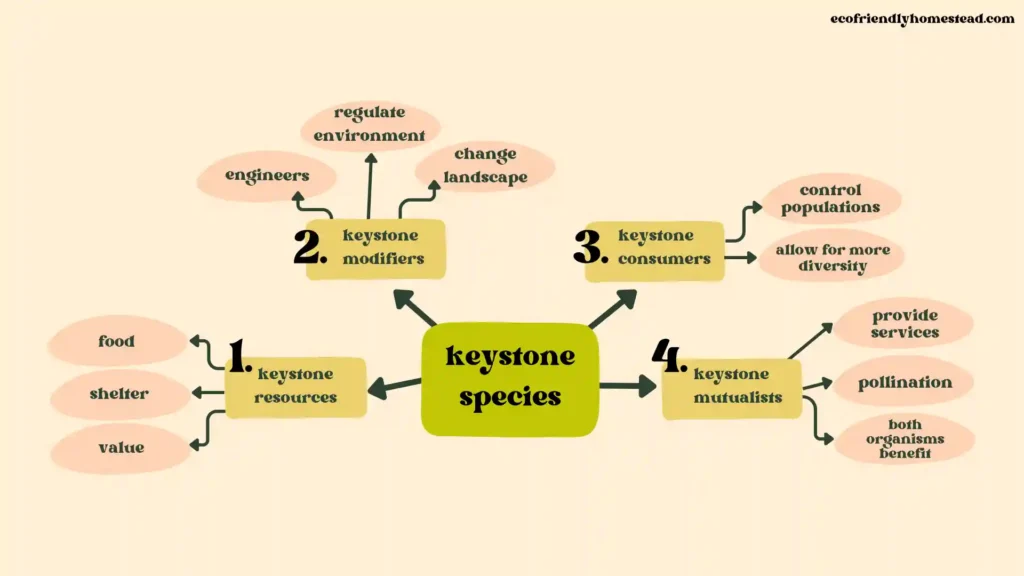
Concept maps are drawings that show how ideas connect. They use boxes and lines to link different topics together.
Students use these maps to:
- See how nature works
- Remember facts better
- Understand difficult topics
- Study for tests
- Share ideas with others
Parts of a Concept Map
- Main topic in the center
- Related ideas around the edges
- Lines connecting the ideas
- Short phrases explaining connections
- Colors to group similar things
How Might You Add Keystone Species to a Concept Map: Simple Steps
Follow these easy steps to build your map:
Step 1: Pick Your Main Topic
Start with one ecosystem type:
- Forest
- Ocean
- Desert
- Grassland
- River
Step 2: Choose One Keystone Species
Pick a species you know well:
- Gray wolf
- Sea otter
- African elephant
- Beaver
- Shark
Step 3: List What They Do
Write down their main jobs:
- Hunt other animals
- Build homes
- Eat certain plants
- Change water flow
- Create shelter for others
Step 4: Show the Connections
Draw lines between your keystone species and:
- Animals they eat
- Places they live
- Plants they affect
- Other species they help
- Problems they solve
Easy Ways to Organize Your Map
The Star Method
Put your keystone species in the middle. Draw lines going out like star rays. Each line connects to something the species affects.
Benefits:
- Simple to understand
- Easy to read
- Shows main connections
- Good for beginners
- Works on small screens
The Tree Method
Start with the ecosystem at the top. Put the keystone species below it. Add affected species under that.
Benefits:
- Shows order of importance
- Clear hierarchy
- Easy to follow
- Good for complex topics
- Mobile-friendly layout
The Web Method
Connect everything to everything else. Show how species affect each other in circles.
Benefits:
- Shows real complexity
- Demonstrates feedback loops
- Advanced understanding
- Research-level detail
- Interactive possibilities
Real Examples You Can Use
Example 1: Sea Otters in Kelp Forests
How might you add keystone species to a concept map about sea otters?
Main Topic: Kelp Forest Health
Keystone Species: Sea Otter
Key Connections:
- Sea otters eat sea urchins
- Fewer urchins means more kelp
- More kelp means more fish
- More fish means healthier oceans
- Healthy oceans help humans
Simple Words to Use:
- “eats”
- “controls”
- “helps grow”
- “provides home for”
- “protects”
Example 2: Wolves in Yellowstone
Main Topic: Forest Recovery
Keystone Species: Gray Wolf
Key Connections:
- Wolves hunt elk
- Fewer elk eat fewer trees
- More trees grow by rivers
- Rivers flow better
- More animals return
Connection Words:
- “hunts”
- “reduces”
- “allows growth of”
- “improves”
- “brings back”
Example 3: Bees and Flowers
Main Topic: Plant Reproduction
Keystone Species: Honeybee
Key Connections:
- Bees visit flowers
- Bees carry pollen
- Plants make seeds
- New plants grow
- Animals have food
Simple Phrases:
- “visits”
- “carries”
- “helps make”
- “creates”
- “feeds”
Tools for Making Maps
Free Online Tools
- Google Drawings
- Canva (free version)
- Draw.io
- MindMeister
- Lucidchart (basic plan)
Paper and Pencil
Sometimes the old way works best:
- Cheap and easy
- No internet needed
- Quick to change
- Good for brainstorming
- Works anywhere
Mobile Apps
- SimpleMind
- MindMaps
- Coggle
- XMind
- iThoughts
Tips for Better Maps
Keep It Simple
- Use short sentences
- Pick easy words
- Limit colors
- Make text big enough to read
- Leave white space
Make It Clear
- One idea per box
- Straight lines when possible
- Consistent colors
- Readable fonts
- Logical flow
Test on Phones
- Check text size
- Make sure lines are visible
- Test with different screen sizes
- Keep important info at top
- Use vertical layouts
Common Problems and Fixes
Problem: Too Much Information
Fix: Break into smaller maps
- One map per ecosystem
- Focus on main relationships
- Save details for later
- Use simple examples
- Link maps together
Problem: Confusing Lines
Fix: Use different line types
- Solid lines for strong connections
- Dotted lines for weak ones
- Arrows to show direction
- Colors for different types
- Thick lines for important links
Problem: Hard to Read
Fix: Improve the design
- Bigger text
- Better contrast
- More space between items
- Simpler background
- Mobile-first approach
Teaching with These Maps
For Teachers
Start lessons with simple questions:
- What animals live here?
- What do they eat?
- What happens if they leave?
- Who else gets affected?
- How can we help them?
Classroom Activities
- Students draw their own maps
- Groups work on different species
- Compare maps between teams
- Add new information together
- Present to other classes
Assessment Ideas
Check if students can:
- Name keystone species
- Explain their importance
- Draw simple connections
- Use proper vocabulary
- Apply to new examples
Advanced Techniques
Adding Numbers
Include basic data:
- Population sizes
- Years of study
- Percentage changes
- Distance measurements
- Time periods
Showing Time
Add time elements:
- Seasonal changes
- Growth over years
- Before and after comparisons
- Life cycle stages
- Historical data
Multiple Ecosystems
Connect different places:
- Migration routes
- Seasonal movements
- Climate effects
- Human impacts
- Conservation efforts
Why This Matters for Conservation
Understanding Threats
Maps help show:
- Which species need protection
- How losing one affects many
- Where to focus efforts
- What changes to expect
- How to measure success
Education Value
Good maps teach:
- Species connections
- Ecosystem health
- Conservation needs
- Human responsibility
- Action steps
Real Impact
When people understand keystone species:
- They support protection efforts
- They make better choices
- They vote for conservation
- They donate to causes
- They spread awareness
Creating Maps for Different Ages
Elementary Students
- Use big pictures
- Simple words only
- Bright colors
- Few connections
- Local examples
Middle School
- Add more details
- Include basic science terms
- Show cause and effect
- Use regional examples
- Connect to current events
High School
- Complex relationships
- Scientific vocabulary
- Multiple ecosystems
- Global examples
- Research connections
Adults
- Technical accuracy
- Policy implications
- Economic factors
- Management strategies
- Conservation priorities
Mobile-Friendly Design
Screen Considerations
- Vertical layout works best
- Large touch targets
- Readable text size
- Simple navigation
- Fast loading
Interactive Elements
- Clickable nodes
- Expandable sections
- Zoom capabilities
- Touch-friendly controls
- Voice-over support
Measuring Success
Student Understanding
Look for students who can:
- Identify keystone species quickly
- Explain their roles clearly
- Predict ecosystem changes
- Connect to real situations
- Teach others
Map Quality
Good maps have:
- Clear organization
- Accurate information
- Easy navigation
- Visual appeal
- Educational value
Future Applications
Technology Integration
New tools emerging:
- Virtual reality experiences
- Augmented reality overlays
- Interactive simulations
- Real-time data feeds
- Collaborative platforms
Research Connections
Maps can link to:
- Current studies
- Live camera feeds
- Citizen science projects
- Conservation updates
- Educational resources
Conclusion
How might you add keystone species to a concept map? Start simple with one species and ecosystem. Use clear connections and easy words. Practice with different tools and examples. Visual maps help students understand nature better. When people see how keystone species connect everything, they care more about protecting ecosystems. Begin your first map today and share what you learn with others.
